


The Hidden Cost of Auto-Renewals: How Mid-Market Procurement Teams Are Bleeding Money
By the Numbers: The True Scale of the Problem

Based on studies covering 140+ mid-market organisations between 2006 and 2025, missed or unmanaged renewals erode 9-15% of annual revenue, trim contract value by 8.6%, and leave 71% of firms unable to locate at least 10% of their agreements.
What this means: Imagine your company makes £10 million a year. Poor contract management could be costing you up to £1.5 million annually—money that's simply disappearing because no one's keeping track of when contracts renew.
Solve this challenge with Gatekeeper.

The Financial Breakdown
Direct Losses Per Company:
Average annual cost: $393,000
Direct financial impact: $120,000 (30.5%)
Opportunity costs: $115,000 (29.3%)
Strategic costs: $98,000 (24.9%)
Operational overhead: $60,000 (15.3%)
What this means: Think of it like a leaky bucket. Every year, nearly £400,000 drains out through four different holes: unexpected renewal fees, missed chances to negotiate better deals, strategic planning disruptions, and the overhead of constantly playing catch-up.
Industry Impact Analysis
Missed Renewal Rates by Sector:
Technology: 8%
Financial Services: 10%
Manufacturing: 12%
Healthcare: 15%
Retail: 18%
What this means: If you're in retail, nearly 1 in 5 of your contracts auto-renew without anyone noticing. Tech companies do better—only 1 in 12 slip through the cracks. It's like having a security system where some industries leave more doors unlocked than others.
Manufacturing Deep Dive:
Average contracts per company: 450
Average contract value: $85,000
Total annual losses: $4.59 million
What this means: A typical manufacturing company juggles 450 contracts worth £85,000 each. With a 12% miss rate, that's 54 contracts auto-renewing unexpectedly every year—costing nearly £5 million in avoidable expenses
The Time-Cost Cascade
Month 1: Initial discovery - $45,000
Month 4: Legal review phase - $60,000 (cumulative)
Month 6: Crisis management - $82,000 (cumulative)
Month 9: System implementation - $117,000 (cumulative)
Month 12: Full recovery cost - $135,000 (cumulative)
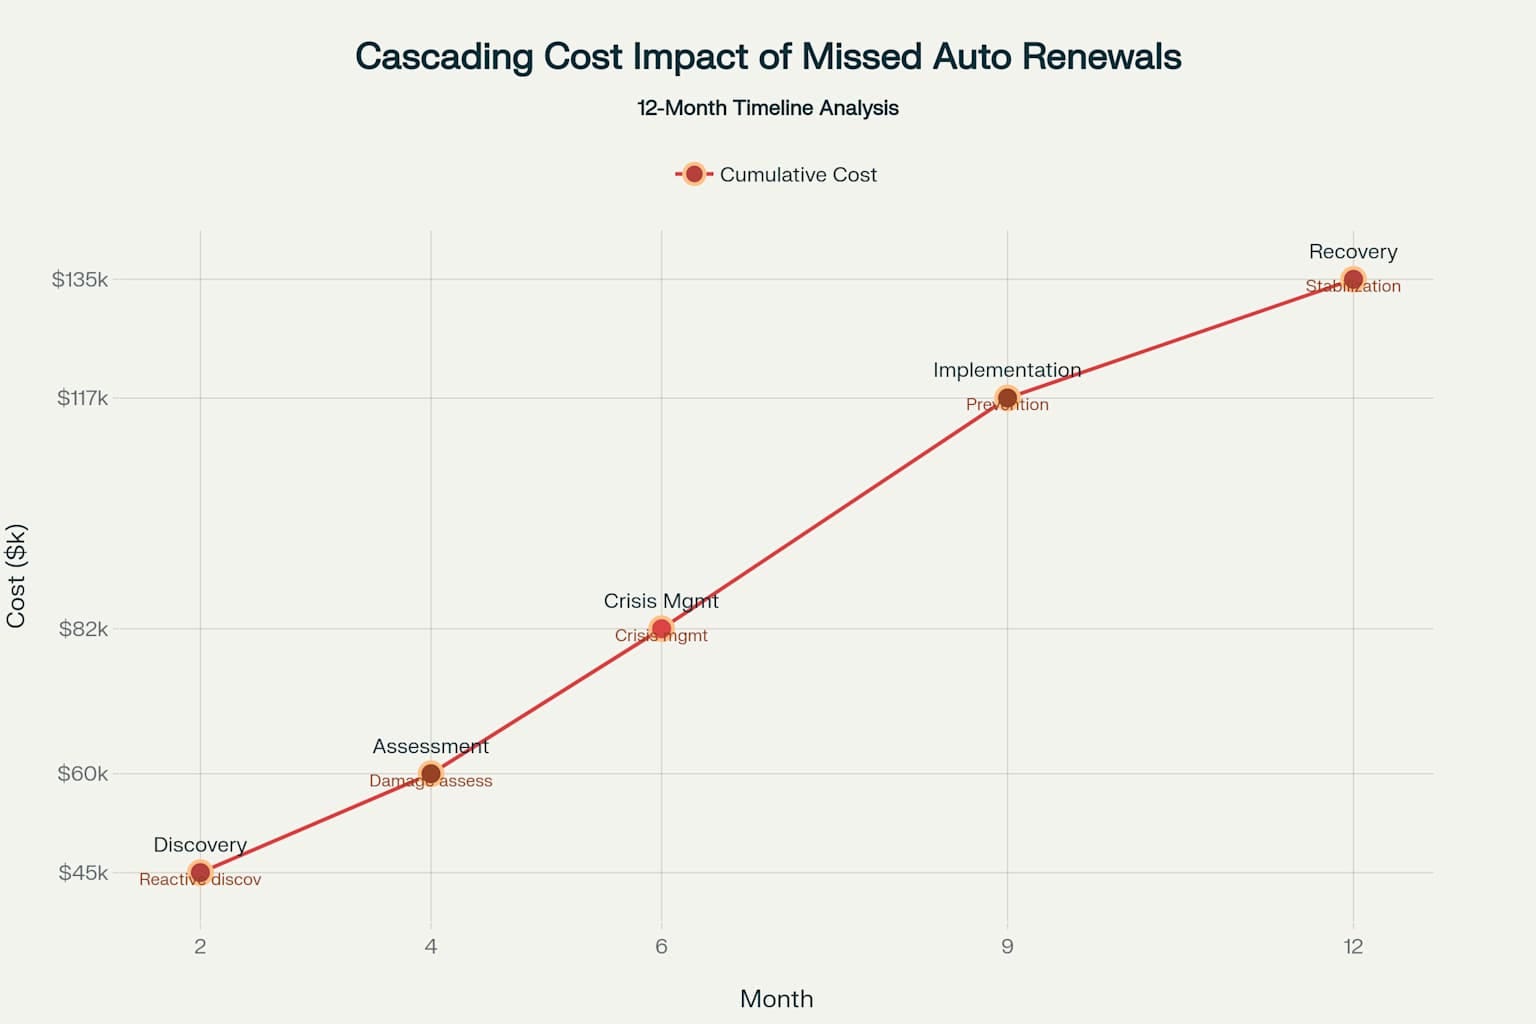
What this means: Missing one auto-renewal is like watching a small kitchen fire spread through your house. What starts as a £45,000 "oops" moment becomes a £135,000 disaster as lawyers get involved, emergency fixes are needed, and new systems must be built to prevent it happening again.
Shadow IT Amplifies the Problem
30-40% of total IT budgets go to shadow IT spending
$18 million average annual spend on unused software licenses
ChatGPT now ranks as top unauthorised application in enterprise shadow IT
What this means: Your employees are buying software you don't know about—lots of it. It's like discovering your family has been ordering takeaway every night while you've been meal planning and grocery shopping. Instead of wasted food, it's millions in unused software renewals.
Solution ROI Comparison
Manual Tracking (Spreadsheets):
Effectiveness: 30%
3-year ROI: 342%
Basic Contract Management Software:
Effectiveness: 65%
3-year ROI: 870% (Highest ROI)
Advanced CLM with AI:
Effectiveness: 85%
3-year ROI: 457%
Dedicated Procurement Teams:
Effectiveness: 90%
3-year ROI: 61%
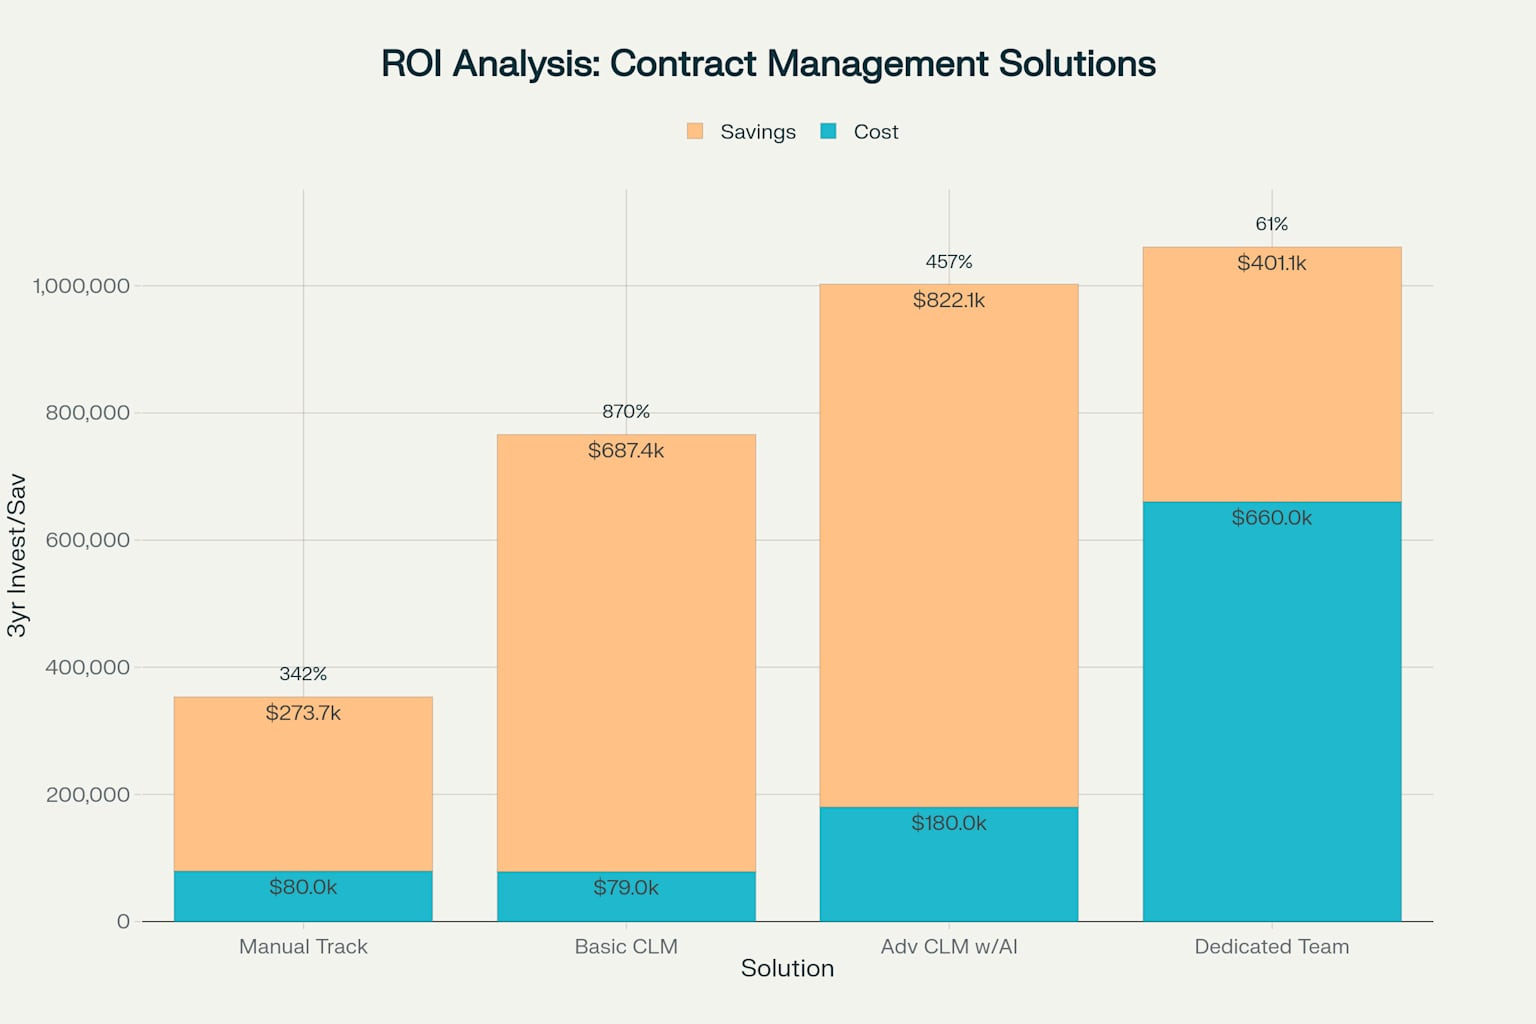
What this means: Spreadsheets are like using a diary to track your contracts—better than nothing, but you'll still miss things. Basic software is like having a smart assistant that prevents most problems and pays for itself 8 times over. Advanced AI is like hiring a genius assistant—more effective, but it comes at a higher cost. A dedicated team is like hiring a full-time guard—most effective but expensive.
Timing Intervention Analysis
Immediate Action (Month 1):
Loss prevention: 90%
ROI: 607%
Early Intervention (Month 3):
Loss prevention: 75%
ROI: 293%
Late Intervention (Month 12):
Loss prevention: 25%
ROI: -21% (Negative returns)
What this means: Fixing contract problems is like treating a medical condition—catch it early, and treatment is cheap and effective. Wait too long, and not only does treatment become expensive, but you might never fully recover. Act within the first month, and you'll prevent 90% of problems while recouping six times your investment.
Risk Probability Matrix
Total Expected Annual Cost: $329,000
Financial Risks: $111,750
Budget overruns: 85% probability
Cash flow disruption: 60% probability
Operational Risks: $87,500
Service disruptions: 70% probability
Vendor relationship damage: 45% probability
Strategic Risks: $129,750
Competitive disadvantage: 55% probability
Missed innovation opportunities: 40% probability
What this means: Poor contract management creates a cascade of problems. It's like driving with worn brakes—you're almost sure to have budget problems (85% chance), very likely to face service interruptions (70% chance), and probably going to damage important business relationships (45% chance). The total annual expected cost is £329,000.
The Bottom Line
The cost of inaction: Organisations lose an average of $393,000 annually to missed renewals, with 71% unable to track their contract portfolio effectively.
Data sourced from procurement industry studies spanning 140+ mid-market organisations (2006-2025), contract management effectiveness research, and shadow IT spending analysis.
If you found this useful, please share this data-based article.